Plot representation of the screen plate. Several plots can be accessed through the NEXT/BACK links at the bottom of the page. Two measurements from the NeuriteQuant analysis are represented in the two axis of the plot. Each position of the screen plate is shown as a single spot representing the average of the two measurements. The raw image data and the image processing reports are immediately accessible by clicking on any spot in the plot representation.
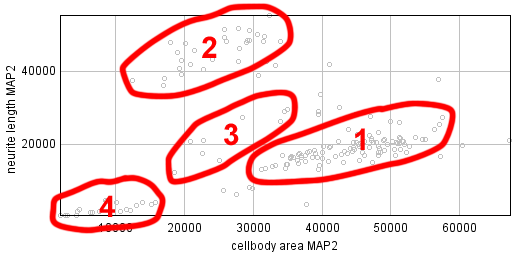
This plot shows measurements of neurite length vs. neuronal cellbody area based on the dendrite marker MAP2. Several broad clusters are seen, which represent 1. normal dendrite length, 2. strong increase in dendrite length by taxol, 3. intermediate increase in dendrite length by Cytochalasin D, 4. toxic inhibition of neuronal growth by high levels of nocodazole or actinomycin D.
 HOME
NEXT
HOME
NEXT