Databrowser - Home

The example screen shows the effect of pharmacological compounds on the development of primary hippocampal neurons. The heatmaps facilitate easy evaluation of gradual changes in morphometric parameters induced by titration of these compounds (for example here). The top and bottom rows are DMSO treated controls, the 2nd and 3rd rows were treated with decreasing amounts of cytochalasin D. The following sets of duplicate rows were treated with taxol, nocodazole and actinomycin D respectively. By clicking on individual positions, more experimental information and raw data is accessible. The X-Y plots facilitate identification of treatments that result in a related phenotypic outcome. For example, X-Y Plot 4 shows 4 distinct clusters, which represent (from left to right) 1. taxol induced decrease of axon branching, 2. normal branching, 3. increased branching by low levels of nocodazole or actinomycin D, 4. excessive cell death induced by high levels of nocodazole or actinomycin D.

Click here to browse all heatmap representations of the screen plate.

5a-norm Heatmaps

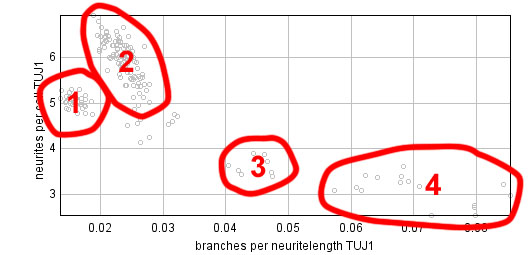
Click here to browse all X-Y plot representations of the screen plate.

5a-norm X-Y Plots

Click here to see review the analysis configuration file.

ini-file