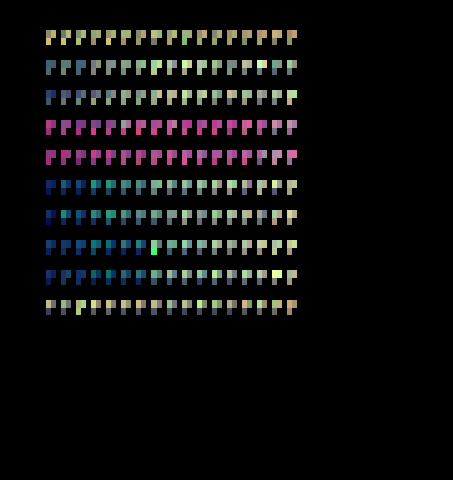
Heatmap representation of the screen plate. Access additional heatmaps through the NEXT/BACK links at the bottom of the page. Three measurements from the NeuriteQuant analysis are represented by the three principal colors red, green and blue. Each position of the screen plate is shown as a cluster of colored spots representing the individual images analyzed per position. The raw image data and the image processing reports are immediately accessible by clicking on any cluster in the heatmap representation. This particular heatmap uses the following color coding:
red: neurite length TUJ1
green: cellbody area TUJ1
blue: mean intensity TUJ1
This map differs from the previous map in the choice of marker to detect neurites. Analysis in the previous map was based on the dendritic marker MAP2. This map is based on the general neurite marker TUJ1, which also detects axons. In contrast to the previous map, no red-shift is detected with increasing Cytochalasin D amounts (rows 2 and 3, from right to left) suggesting that Cytochalasin D does not affect the ratio of TUJ1-labeled neurites vs. TUJ1-labeled neuronal cellbodies. In contrast, here, a shift to darker blue colors is observed at the highest Cytochalasin D levels, suggesting that both neuritelength and neuronal cellbody area decrease under these conditions. Click NEXT to review other aspects of this morphometric analysis.